
- 480
- 2 045 442
Stats4Everyone
Приєднався 10 жов 2013
Why the constant is squared when finding the Variance of aX. Proof that Var(aX)=a^2Var(X)
Why the constant is squared when finding the Variance of aX. Proof that Var(aX)=a^2Var(X)
Переглядів: 558
Відео
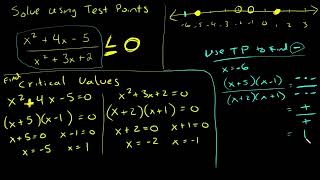

Solve rational inequality by factoring and using test points
Переглядів 848 місяців тому
Solve rational inequality by factoring and using test points
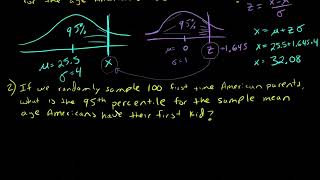
Using Z (Standard Normal) Table to find the Percentiles for X and a Sample Mean, X-bar (using CLT)
Переглядів 978 місяців тому
Using Z (Standard Normal) Table to find the Percentiles for X and a Sample Mean, X-bar (using CLT)

Why is X non-random in Linear Regression? What does it mean for X to not be random?
Переглядів 816Рік тому
Why is X non-random in Linear Regression? What does it mean for X to not be random?

Proof that the Sum (xi - xbar)xi = Sum (xi - xbar) * (xi - xbar) = Sxx
Переглядів 2,8 тис.Рік тому
Proof that the Sum (xi - xbar)xi = Sum (xi - xbar) * (xi - xbar) = Sxx
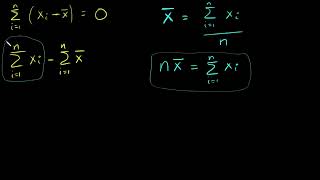
Proof that the Sum of (xi - xbar) = 0
Переглядів 3,7 тис.Рік тому
Proof that the Sum of (xi - xbar) = 0
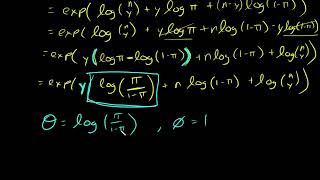
Deriving the Binomial canonical link function, logit, for Generalized Linear Model (GLM)
Переглядів 1,9 тис.Рік тому
Deriving the Binomial canonical link function, logit, for Generalized Linear Model (GLM)

GLM Link Function, and Canonical Links
Переглядів 3,1 тис.Рік тому
GLM Exponential Family, Finding theta for Normal distribution: ua-cam.com/video/wqIcv3Wehug/v-deo.html GLM Exponential Family, Finding theta for Poisson distribution: ua-cam.com/video/OfvWpRxISU0/v-deo.html

GLM Exponential Family, Example with Poisson distribution finding functions a, b, and c
Переглядів 1,9 тис.Рік тому
GLM Exponential Family, Example with Poisson distribution finding functions a, b, and c
GLM Exponential Family, Prove that Var(Y) = b''(theta)*a(phi)
Переглядів 1,1 тис.Рік тому
GLM Exponential Family, Prove that Var(Y) = b''(theta)*a(phi)
GLM Exponential Family, Prove that the mean is the first derivative of b, E(Y) = mu = b'(theta)
Переглядів 1,6 тис.Рік тому
GLM Exponential Family, Prove that the mean is the first derivative of b, E(Y) = mu = b'(theta)
GLM Exponential Family, Example with Normal distribution finding functions a, b, and c
Переглядів 4,5 тис.Рік тому
GLM Exponential Family, Example with Normal distribution finding functions a, b, and c
Simple linear regression, Variance of a residual, Yi and Yhat independence. Plus or Minus sign?
Переглядів 2 тис.Рік тому
Simple linear regression, Variance of a residual, Yi and Yhat independence. Plus or Minus sign?
Deriving Confidence Interval vs Deriving Prediction Interval
Переглядів 906Рік тому
For more details regarding deriving confidence interval for a mean response, please see this video, ua-cam.com/video/D0hEr2zngw0/v-deo.html For more details regarding deriving prediction interval, please see this video, ua-cam.com/video/tJ8cv-fFPHs/v-deo.html
Proof for the Probability of a Union of Three Events
Переглядів 2,7 тис.Рік тому
This is a long proof, though it is worth it to see how we arrived at the solution for the probability of a union of three events. The same ideas here are used as those used to find the probability of a union of two events: ua-cam.com/video/m67AKAWM3gA/v-deo.html
Using Venn Diagrams, show that if A is a subset in B, then B complement is a subset of A complement
Переглядів 2,6 тис.Рік тому
Using Venn Diagrams, show that if A is a subset in B, then B complement is a subset of A complement
Why is the Variance of the Sample Mean equal to Sigma^2/n ? How to find the Variance of X-bar
Переглядів 8 тис.Рік тому
Why is the Variance of the Sample Mean equal to Sigma^2/n ? How to find the Variance of X-bar
Where did 1/(1-exp(x*beta)) come from in Logistic Regression?
Переглядів 901Рік тому
Where did 1/(1-exp(x*beta)) come from in Logistic Regression?
How to Derive the Maximum Likelihood Estimators for Logistic Regression
Переглядів 6 тис.Рік тому
How to Derive the Maximum Likelihood Estimators for Logistic Regression
Prove Sum yi(xi - xbar) = Sum (yi - ybar)(xi - xbar)
Переглядів 7 тис.Рік тому
Prove Sum yi(xi - xbar) = Sum (yi - ybar)(xi - xbar)
How to Derive the Score Vector for the Maximum Likelihood Estimators of a Logistic Regression
Переглядів 1,8 тис.Рік тому
How to Derive the Score Vector for the Maximum Likelihood Estimators of a Logistic Regression
Set Theory Example: A Complement Intersection B = A' ∩ B = A^c ∩ B
Переглядів 1,2 тис.Рік тому
Set Theory Example: A Complement Intersection B = A' ∩ B = A^c ∩ B
Set Theory Example: Intersection of three Events: A Intersection B Intersection C = A ∩ B ∩ C
Переглядів 858Рік тому
Set Theory Example: Intersection of three Events: A Intersection B Intersection C = A ∩ B ∩ C
Set Theory Example: Union of three Events: A Union B Union C = A U B U C
Переглядів 1,3 тис.Рік тому
Set Theory Example: Union of three Events: A Union B Union C = A U B U C
Set Theory Examples: A Intersection (B Union C) = A(BUC) = A∩(BUC)
Переглядів 1,2 тис.Рік тому
Set Theory Examples: A Intersection (B Union C) = A(BUC) = A∩(BUC)
Set Notation Examples: Sample Spaces is the real number line: Find Complement, Union, Intersection
Переглядів 690Рік тому
Set Notation Examples: Sample Spaces is the real number line: Find Complement, Union, Intersection
Introduction to Set Notation: Complement, Union, Intersection, Sample Space, Event, Element
Переглядів 452Рік тому
Introduction to Set Notation: Complement, Union, Intersection, Sample Space, Event, Element
Interpreting R squared building up from interpreting variance (and standard deviation)
Переглядів 249Рік тому
Interpreting R squared building up from interpreting variance (and standard deviation)
Calculating Normal Probabilities in Excel for a single observation and for the sample mean
Переглядів 775Рік тому
Calculating Normal Probabilities in Excel for a single observation and for the sample mean
Amazing content on this channel! Very crisp explanations. A playlist on machine learning topics such as Logistic Regression, Gradient Descent Optimization, PCA, SVM, Decision Trees, Multi-layer Perceptrons, feed-forward neural networks, etc would be amazing!
This taught me in the first two minutes what my graduate-level professor was unable to teach over two days. Thanks!
Thank you! Great presentation!
I am very glad this came up on Google. Thank you for making this and for giving it a title that came up in my haphazard googling.
Mam, please upload lectures of BAYESIAN STATISTICS
Wow❤🎉
Im doing a variation of this problem where Pk is the probability that no two people share the same birthday, and I am supposed to show that it is maximized when all birthdays are equally likely. Which means that for any birthday i, Pi = 1/n where n is the number of possible birthdays. Anyone know how I should start going about this?
Because generally the problem has you assume that each birthday is equally likely in order to find the probability, but here I am simply supposed to prove that the probability is maximized under that assumption
Thanks you are very helpful!
YA SEN NE BÜYÜK Bİ ADAMSIN BE KARDŞEİM
Ya sen dünyanın en iyi matematikçisin aq ya adamsın adam
you just saved my ass on this problem set thank you 🥲
Thanks for the amazing video! Very intuitive and well-explained. How would derive the same for multiple non-linear regression. For eg: Exponential curve-fit: y = e^(ax), where a is the parameter
how did you express Var(x bar) in terms of expected value of (x bar square) and (expected value of x bar) square . Where can I read more theory about it.
cool examples! Now I understand the concept of pdf
very helpful, thank you so much!
Great explanation! Thank you.
Thank you soo much, just what I needed.
Wow thank you so much for your explanation Im really so glad that you use different colors for deriving something out of the main problem ❤ It helps us to understand better 💓Again Thank you so much😄
How do you display the selection summary output that actually shows you the CP term? I keep getting a table that shows the AIC, SBIC, and SBC. Do you know why this discrepancy in our output exists? I am using the same package and function as you are.
KK Wagh Institute Of Engineering Education And Research, Nashik
Thank you
very helpful! Thank you!
yooooo that's really good thank you!
You're a life saver!!!! 1 hour before exam and you helped me understand it perfectly! Thank you!
Thank you
You are amazing, thank you, thank you, thank you.
THANK YOU 🙏
The dimension of the X matrix should be N x (P+1) . Since there are P features but we have an additional column consisting of only 1's.
❤
why sum of (x-xbar)ybar would be zero in 4.29 while it is not zero with sum of (xi-xbar)yi??
Good question. Thank you for posting this comment. ybar is a constant (it is the same number for all i), therefore, we can factor it as follows: sum (xi-xbar)*ybar = ybar * sum(xi-xbar) sum(xi - xbar) = 0 . For proof, please see this video: ua-cam.com/video/oyjkFmNMMKA/v-deo.html Therefore, sum (xi-xbar)*ybar = ybar * sum(xi-xbar) = ybar * 0 In contrast, yi can not be factored, because it is not a constant, and changes with i. Therefore, sum (xi-xbar)*yi is not zero, because for each i, xi-xbar is being multiplied by yi.
Thanks for the video this helped me a lot. But in my course ists the other way around when you have 1/n its an unibiased estimator and when you have 1/n-1 its biased so now im lost again😂
In your course, if the estimator for sample variance? For example, if you are estimating a mean, the unbiased estimator would have n in the denomiator... Though for sample variance, the proof that I provide in this video is correct. Here is another source that might be helpful: en.wikipedia.org/wiki/Bias_of_an_estimator#:~:text=Sample%20variance,-Main%20article%3A%20Sample&text=Dividing%20instead%20by%20n%20%E2%88%92%201,results%20in%20a%20biased%20estimator.
Thank you Mam for this beautiful lecture series.
Thank you for the comment and encouragement :-)
Nice,
Thank you for the video, very helpful. What if the equation is like Var (X ̅) = 1/n ∑Var (Xi) ?
At min 3:15, I have written a similar equation, though your equation is missing that 1/n is squared (maybe that was a typo?). Here is the correct equation: Var ( Xbar ) = (1/n)^2 ∑ Var(Xi)
Please could you explain at 3:30 why Var(xi) = σ^2 rather than s^2 ? Isn't σ^2 the population variance, but xi is defined from i=1 to n so isn't it a sample? Or is the population only defined from i=1 to n?
Good question. Thanks for this post. Towards the beginning of this video, I discuss this a little, though I can try to elaborate here. I will break down your questions below: 1. why Var(xi) = σ^2 rather than s^2 ? s^2 is an estimator for the population variance σ^2. In other words, s^2 estimates σ^2 using the sample x1, x2,...xn. Just like x-bar is an estimator for the population mean, mu. By definition, X is a random variable with mean mu, and variance σ^2. While we may not know the variance, σ^2, and mean, mu, all xi's sampled from the random variable X will have variance, σ^2, and mean, mu. Using the xi's sampled from the random variable X, we can estimate the variance, σ^2, using s^2, and the mean, mu, using the sample mean, x-bar. 2. Isn't σ^2 the population variance, but xi is defined from i=1 to n so isn't it a sample You are correct that σ^2 the population variance. Also, you are correct that xi, for i=1,2..n is a sample. xi is a sample observation of the random variable x, which has variance σ^2. 3. Or is the population only defined from i=1 to n? The population is not only defined only for i=1 to n. It does not matter how many times we sample from the random variable x, the variance will always be σ^2 by definition of x. I hope this helps. If you have any follow-up questions, please let me know.
@@Stats4Everyone Thank you for the reply. So each random variable Xi has variance σ^2 before it is defined, I think I understand now.
Beautiful. Amazing. I was waiting to see this kind of an explanation. Thanks
Glad it was helpful!
Thank you for this video, you explained everything really cleary and step by step :)
Great to hear! I'm glad it was helpful!
Am I right, that this works only when the distribution of the variables are the same?
Yes. Good question. Most importantly, all xi, for i=1..n, must have the same variance, σ^2, which is discussed a little towards the beginning of the video, near min 0.20.
Why sample mean is higher than population mean
Good question. Thanks for this comment. The population mean is not known. Therefore, we can not say for a fact that the "sample mean is higher than population mean". Since the sample mean is a random number (based on random sampling), the sample mean is occasionally more than the population mean, and occasionally less than the population mean, though on average, if we were to repeatedly take samples, the sample mean will be equal to the population mean. This is the law of large numbers (en.wikipedia.org/wiki/Law_of_large_numbers) In this video example, we want to know if a college student spends more than 20 hours per week studying. Therefore, we want to know if the population mean is more than 20. This is our question: Is mu > 20? To answer this question, we obtained a random sample, and found that the sample mean is 23 hours per week. The sample is random. A different sample of 36 students would yield a different sample mean. I hope this makes sense and is helpful!
Very helpful
Glad to hear! Thanks for the comment!
Thank you so much for this beautiful explanation! My professor failed miserably in explaining this.... and it took you less than 10 mins. Just Wow.
Great! Glad that this video was helpful for your classwork :-)
Thank you so much for the great explanation! One question: Is there difference of E[yi] and y_bar ; similar like E[epsilon_i] and epsilon_bar. One is expectation, the other is the average? For example if E[epsilon_i] = 0, then epsilon_bar , the average over sample, also should be zero, right?
Thanks for this comment! I have broken down a response below: 1. Is there difference of E[yi] and y_bar Yes there is a difference. ybar is an estimator for the expected value of y, E(y). ybar is a sample average, whereas the expected value of y, E(y) is the population average. Also, ybar is not conditional on the value of x, rather it is an average over all the different values of x. In a hypothetical example, if we were using tree height, x, to model tree age, y, then ybar is the sample average tree age of all the sampled trees, regardless of their height. E(y) is the population average tree age of all trees in the population, regardless of their height. E(yi) is the expected value of yi. In our hypothetical example, E(yi) is the expected tree age for a particular tree height. In other words, E(yi) is the average tree age for a particular tree height (“expected” and “average” are synonymous). yi is a single observed tree age at a particular tree height. We could observe and sample several values trees at the exact same height, and then average their ages to estimate E(yi). 2. similar like E[epsilon_i] and epsilon_bar Not really… We assume that E[epsilon_i] is zero as a model assumption. This means that the model is explaining the variability in y, and anything else making y vary is just random noise. In the hypothetical example, this means that tree height is the only predictor for tree age and everything else is either controlled or not important in explaining why all trees are not the exact same age (note that this assumption is definitely a stretch and unrealistic in this example…and yet people might run this regression without much thought about whether the model assumptions are reasonable…which is not good). Epsilon_bar. It is important to define this idea. Usually, people use lower case e to denote the sample model error term, since epsilon_i is not observed (unlike y_i, which is observed). The sample average of the model error term, e, is zero by definition. It is a fun exercise to prove the following: If, ei = yihat - yi where yihat = bo + b1xi then, sum ei = 0 therefore e-bar = 0 To do this proof, plug in the estimators bo and b1. I hope this helps! Thanks again for the thoughtful comment!
Thank you, it helps a lot. God bless.
So happy to hear that this video was helpful!
Thankyou soooo much! Awesome video! From India
So happy to hear that this video was helpful! :-)
This is THE BEST channel for stats ever!!! It touches every tiny teeny detail of the assumptions that explains each step without any confusion! Much Appreciation! God Bless!
Thanks so much for this feedback and encouragement!
THE BEST explanation on this topic on UA-cam! Many Thanks! One question though: 1:02 why can we make such assumption #1? Or what's the meaning of that assumption? Xi is nonrandom. Appreciate any advice!
Thanks for this comment! Here is a video that might be helpful: ua-cam.com/video/5Ezg9UXIyZs/v-deo.htmlsi=IkU9c9jmBlIorGw6 First, let's think about Yi, which is a random number. To be a random number, we can think of that as a number that when sampled is randomly not the same number. For example, suppose I am interested in knowing the IQ of people in America. Not everyone's IQ is the same. IQ varries randomly from person to person. Actually, we could measure the IQ of the same person twice and likely get two different numbers. Generally, things that are "measured" are random numbers because exact measurements are very difficult/impossible. A non random number is constant. Age might be a good example of a nonrandom X value. If we know someone's birthday, Age can be calculated exactly.
@@Stats4Everyone Thank you so much for your time and detailed reply! Yup very helpful! So the independent sample data is nonrandom per samples that collected. But the dependent data (the one that measured, the one that we study the relation to the sample's data) are random, cuz even tho we draw the same sample, but the dependent variable we study still subject to vary within a certain distribution. Really appreciate it! Wish all the best to you and your channel!
In "joint pdf find the constant" video you've take limits of dy as from 0 to 2,but now you're using the limits from 0 to x f(x,y)dy whats the difference, I mean why its not from 0 to 2 for marginal of x
nice
Is there a reason when I followed the steps to this I ended up getting a final p-value that was identical to the P-value of the variable that I was testing? Not sure if I missed something but will definitely go back and redo it and see if I get something else.
Very incredible